
Municipal election season is right around the corner. Mark your calendar, October 22, 2018 Ottawa is going to the polls.
Exciting, I know.
At least, for the 39% of eligible voters who turned out last time.
That’s a shade lower than in 2010, when around 44% of eligible voters made it to the polls.
Now, I know that compared to Federal and Provincial politics, municipal issues are a little boring. But, they are the most impactful on your life. Justin Trudeau won’t fill the pothole on your street. Kathleen Wynne won’t be fighting for or against bi-weekly garbage pickup.
The City of Ottawa has kindly posted some very detailed results from the last two elections. I’m talking exact numbers from every polling station across the city. That’s wicked.
Unfortunately for me, the formatting of the documents was questionable. CSVs built like Excel files. Excel files with excessive formatting applied. The works.
Fortunately for you, dear reader, I have done all the legwork, breaking the files down into easy to load datasets. If you wanted to, you could grab them off my github and do your own analysis!
Without further ado, I present to you an analysis of Ottawa’s voting in the last 2 elections. With so much data to use, I’ve decided to break it down over a series of posts. This is Part 1, a wide overview of the last 2 elections.
Check out the code here.
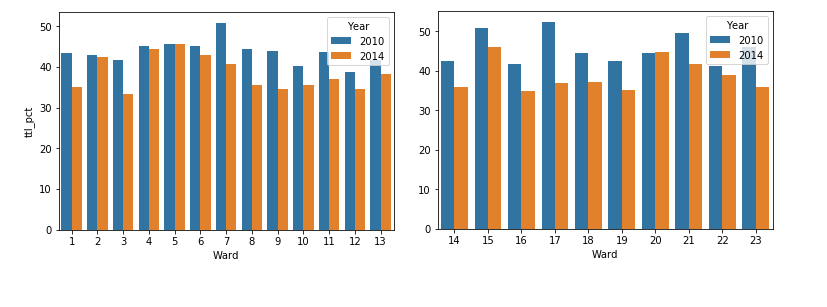
This graph is a percentage breakdown of votes cast, by ward, for the 2010 and 2014 elections. As you can see, turnout was down across the board in the latter election, with the single exception of Osgoode Ward (Ward 20).
Conversely, one man's votes received percentage shows the opposite picture.
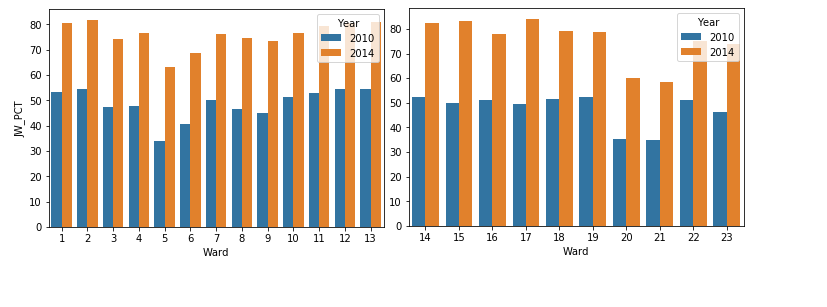
This is Jim Watson's percentage of the vote share in the race for Mayor, 2010 and 2014. As you can see, the lowered voter turnout appears to have benefited him in a big way. From hovering around 50% of the votes in 2010, he made a massive gain in 2014, pulling around 80% of the vote share in many wards.
Now, part of the difference can probably be explained by the fields he faced in both elections. In 2010, Jim Watson was challenging scandal-mired incumbent Larry O'Brien, and this contributed to lowering Watson's total votes.
In 2014, there were no real challengers to his mayorship. This is evident in the voteshare, where Watson basically blew the other contenders out of the water.
Will the trend continue?
Well, it was hinted at in January that a few political heavyweights were pondering a run. Since then, however, all has been quiet on that front. Until the race opens, we will have to play wait and see.
Let's take a look at some poll level data.
There were 327 non-advanced polling locations in 2010, and 333 in 2014. I mapped these, using a scatter plot, based on Registered Voters and Percentage of Votes cast at that poll. Here is the data for 2010:
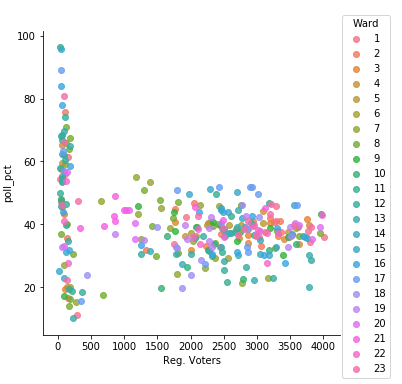
Interesting. As we might have expected, voting locations with lower total voters can reach higher percentages of their voters. However, the distribution for these locations is much more skewed than location with more registered voters. There, the average would hover somewhere around 40% of voters entering, consistent with the final total turnout. How about in 2014?
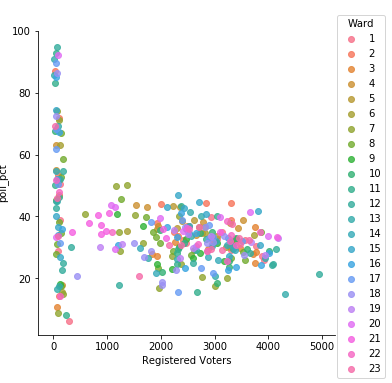
Very similar distribution, with locations with under 500 registered voters having a wider distribution, while the locations with more registered voters hover closer to the total turnout percentage.
Another takeaway is that no ward jumps out as having excessively full, or empty, voting locations. Once again, this conforms to the total voting turnout, with most wards falling close to each other in percentage of turnout.
Personally, I see these low turnout numbers as a problem. Civic issues hit close to home. Literally.
There appears to be significant voter apathy in Ottawa, and in other Canadian cities. This article notes that in 2014, Vancouver had a turnout of 43%, Toronto hit 60%, and Montreal had a 43% turnout in 2013.
This to elect a council to guide and develop the city around us, a group that can have significant impacts on our day to day lives. From potholes, to pot shops, to education, the municpal government is responsible for a significant amount of things that impact our lives.
I think the ball is in the city's court on this kind of problem. Improving Citizen engagement, and expanding the reach of the political campaign across the city, through advertising to increase public awareness, are possible strategies.
These kind of tactics can help a city increase engagement everywhere. If the city reaches a high-schooler, maybe that student will reach their parents, increasing the visibility of the election, and the total turnout.
I'm hopeful our elected leaders, and municipal employees can improve the turnout in the next election. But only time will tell.