THE DRAFT
Every year, all of the NHL General Manager’s gather together in a big room to draw names out of a hat. The multi-million dollar hat that is the NHL Draft.
Okay, it’s not really a hat, but the NHL draft is definitely a gamble, especially as you move towards the later rounds. As a Sens fan, I was mildly interested in the results, with the team making thirteen picks, including three in the top round. I wondered, what are the probabilities that these picks will make an impact for the team?
For those who know absolutely nothing about the draft, each year, every team is given seven picks. At the most recent count, this means 217 names are called over seven rounds. Many teams use the draft as a chance to restock their prospect pool, or trade their draft picks to get proven players.
TSN’s Travis Yost published an article a few years ago investigating some of these probabilities. From 2000-2009, he found that 80% of first-round draft picks, but under 20% of fifth, sixth, and seventh-round picks, will play more than 50 games in the NHL, which under his methodology amounts to an NHL career. I have adopted this methodology as well
THE DATA
I pulled a wider range of draft data for this probability assessment, from 1990 through to 2018. However, as players drafted in 2018 may not have had enough developmental time to be considered “career” players, I will only use data up to 2015.
Data from this period is a bit messy. From 1990 until 2000, the NHL went through a period of turmoil. Franchises moved from cities, and a period of expansion brought the league up to 30 teams. At the same time, the NHL draft changed. At the start of this period, it was twelve rounds of selections. After the 2004 lockout, where no games were played at all, the draft became the familiar seven-round format.
To compensate for these differences, I will bin my players a little differently than round-by-round. As the most stable period in recent history was a thirty-team league (from the 2001 to the 2017 season), I will bin drafts into groups of 30. This will mean in many drafts the final bin will have less than thirty players. However, I think this will make up for the changing number of players per round/year and keep the level of selections fairly equal across rounds. I will also drop bins beyond bin seven for calculating probabilities related to current drafts, though not for the entire analysis (as these still count as draft picks made).
ANALYSIS
Overall, from 1990 to 2015, a draft pick has a 28.8% chance of having a career. In other words, a team with seven draft picks in a year might expect two of these players to become permanent players. Since the seven rounds format was only instituted in 2005, post-lockout, I have also calculated the numbers for 2005-2015 exclusive.
In this case, the numbers hold remarkably steady to the original average, with 28.9% of draftees making a 50+ game career in the NHL.
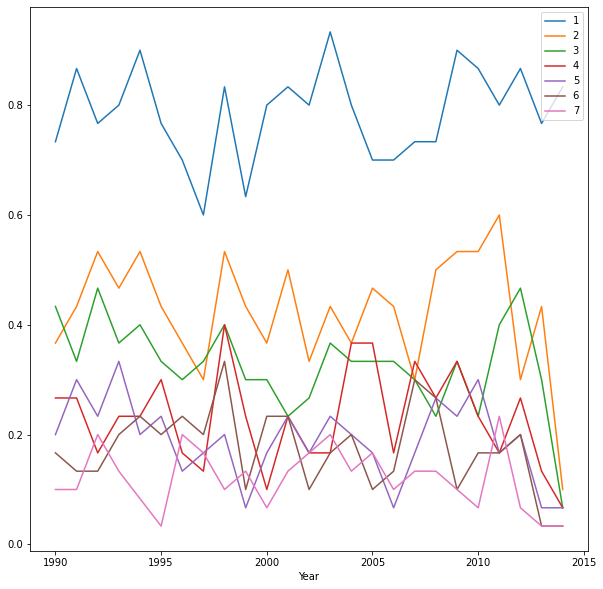
If we look at the 30-player draft bins from 1990-2015, we can see they remain very similar to the numbers found by Travis Yost. About 78% of first bin players will have some kind of career in the NHL, while bins 5 and down are lower than a 20% chance, and draftees from bin 4 have a chance of just 22% to become an NHL player. The following chart (Figure 1) displays the percentage of draftees from each year that went on to have a career.
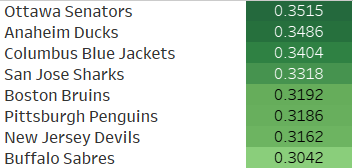
If we switch over to a team-by-team view, as in Figure 2, us Sens fans get some exciting news! Since 1990, the Senators have been the most successful at drafting players that go on to have an NHL career.
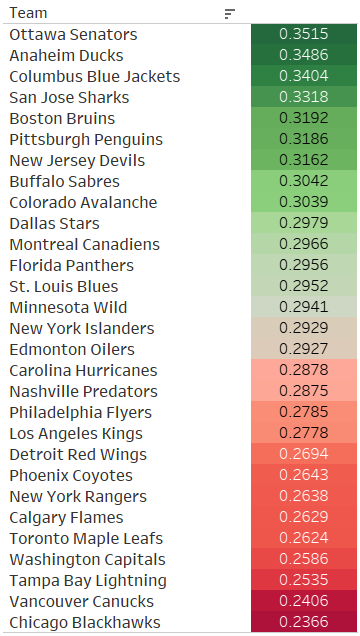
So good, in fact, that in a typical seven-round draft year, Ottawa might expect to get 2.45 NHL players, rather than the average 2-ish. Sounds a little weird when you say it like that…
Since the Senators have 13 draft picks this year, we can ask ourselves what is the probability that those draft picks will turn into full-time NHL players.
Ottawa has decent draft priors, as evinced by the following table. For example, overall first round draft picks have a 77.9% chance of going on to a career, while Ottawa’s first-rounders have an 86.6% chance of the same.
| Bin | Overall | Ottawa |
|---|---|---|
| 1 | 79.9% | 86.6% |
| 2 | 41.2% | 44.4% |
| 3 | 31.4% | 20.8% |
| 4 | 22.3% | 44% |
| 5 | 18.3% | 23% |
| 6 | 16.7% | 22% |
| 7 | 11.4% | 12% |
Table 1: Overall probability of draft-pick making a career, compared to probability of Ottawa draft-pick making a career.
We can use these basic probabilities to determine some possible probabilities – for example, what are the chances that one, two, or three out of their three first round picks from 2020 go on to have a career? To check the probability that multiple events will occur, we can just multiply them together! For example, to check the probability that events A and B will both occur independently of one another, we can plug in the formula P(A, B) = P(A)P(B).
| # of Picks (Bin 1) | Equation | Probability |
|---|---|---|
| 1 | 0.866 | 86.6% |
| 2 | 0.866**2 | 74.9% |
| 3 | 0.866**3 | 64.9% |
Table 2: Probability that one, two, or three of Ottawa's first round draft picks this season will go on to have a career. Note ** represents to the power of.
With this done, we see that there is an 86.6% chance that one draft pick will have a career, a 75% chance for two to have a career, and a 64.9% chance that all three will go on to have a career. Definitely good news!
To add some spice to this draft analysis, we need to consider the ultimate goal of every team, winning the Stanley Cup. The whole purpose of the draft is to bring players into the organization that will help the team achieve this.
With this consideration, I think it is safe to say that the best rosters of a season are the two that compete for the Stanley Cup. These teams have made it through a full season, and a grueling conference playoff to make it there. I checked out the rosters of the Stanley Cup finalists from the 2000 to the 2017 seasons (this gives us 34 rosters to look at).
Of those 34 rosters, just under 60% of players were non-drafted (i.e. traded for, picked up as free agents, or signed as an undrafted free agent). If we break this down to champion and runner-up, the numbers stay almost identical (champion is 59.8% non-drafted, runner-up is 59.7% non-drafted).
We can go a step further now, knowing that roughly 60% of a roster was built through trades or free agency. The average roster size, i.e. all the players that played on these teams, is 25.7. I’ll round that up to 26. This includes players who were picked up late in the year, or who were called up from the AHL. With these numbers, we can see that the average Cup-Finalist is made up of about 15 to 16 non-drafted players, and 10 to 11 drafted players.
So, how often do players switch teams?
In total, 60% of players over this time-period switched teams at least once. Further, 46% of players switched teams more than once. This does not necessarily indicate a high rate of turnover, but it does mean turnover should be expected.
The below figure displays the percentage of players by draft bin (orange) and the percentage of all team switches made by players in that draft bin (blue). Sidenote, undrafted players, and those who were drafted prior to the year this data starts, have been excluded.
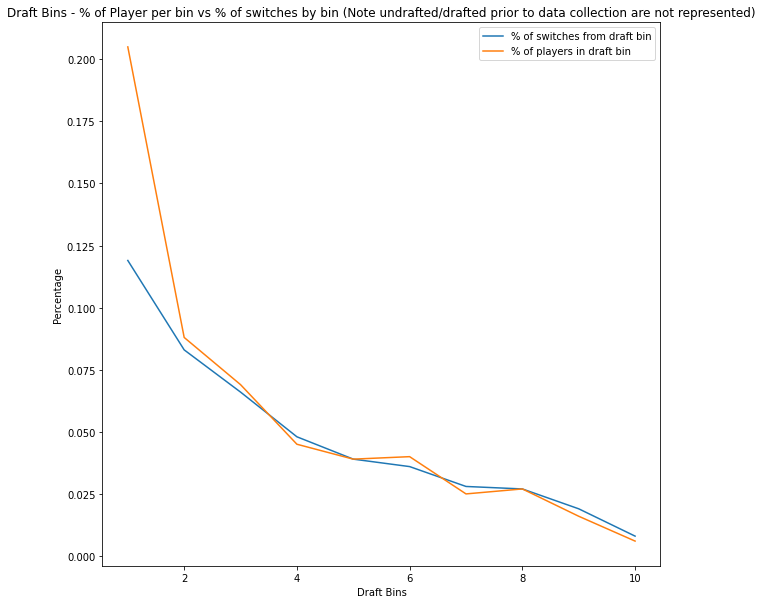
What Figure 3 shows is a significant similarity between the two distributions. With the exception of first-round draft picks, the percentage of NHL players from a given draft bin, and the percentage of team changes made by players in that bin remain very close. However, we see the line skewing towards 0% as we move from Bin 1 to Bin 10, with Bin 1 having a higher percentage of team changes than the remaining bins. We can actually chalk this rate up to the fact that there are simply more players from the first-round playing, and they play for longer than players from other bins.
If we look at this next figure, we get a more realistic picture of movement by players from each draft bin.
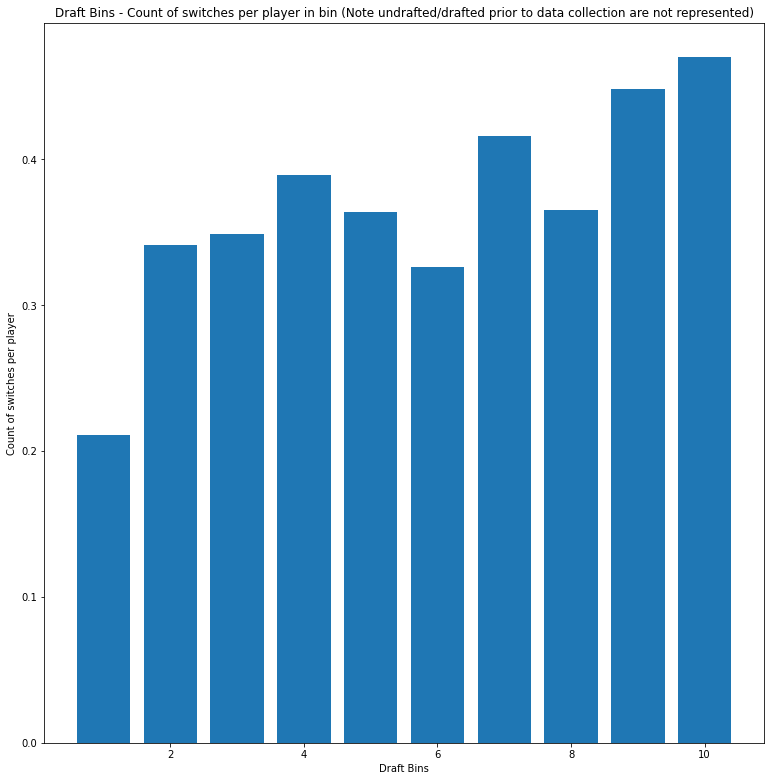
Figure 4 displays the count of team switches per player, per draft bin. What we can see here is that first-bin picks have a 10% lower switch rate than other bins, at around 0.21 switches per player. So first-bin picks do not actually change teams more often than players drafted in other bins, there are simply more of them.
As a Sens fan, we can again turn to these probabilities to ask: what are the chances that our career-having draft picks go on to switch teams?
In this case, we need to multiply the probability that they make the team, with the probability that they will change teams. Note that this is a conditional probability problem. We are now asking what is the chance that a drafted player will switch teams at some point in the future, GIVEN (denoted by | symbol) that they have a career.
P(Switch | Career) = P(Switch)P(Career | Switch) / P(Career)
For those familiar with statistics, this formula should look mighty familiar. This is Bayes Theorem.
Bayes Theorem is one of the fundamental methods for finding probability, and allows us to update our probability estimate given evidence. In the case of our given problem, we are updating our hypothesis of the probability a player will switch teams at least once, given they have a career.
The probability values we input will change with each Bin, but the formula will still look the same. P(Switch) is the probability that a player in that bin will switch teams at least once. P(Career) is the probability of a player in that bin going on to have a career. P(Career | Switch) is the probability that a career player from that bin will switch - This probability is high, as we can assume many players that do not have a career also fail to play for one or more than one team as well. Note that these calculations were done on the global NHL values, rather than the Ottawa-specific values.
| Bin | P(Switch) | P(Career | Switch) | P(Career) | P(Switch | Career) |
|---|---|---|---|---|
| 1 | 0.205 | 0.873 | 0.779 | 22.9% |
| 2 | 0.088 | 0.833 | 0.412 | 17.8% |
| 3 | 0.069 | 0.845 | 0.314 | 18.5% |
| 4 | 0.045 | 0.863 | 0.223 | 17.4% |
| 5 | 0.039 | 0.822 | 0.183 | 17.5% |
| 6 | 0.04 | 0.825 | 0.167 | 19.7% |
| 7 | 0.025 | 0.836 | 0.114 | 18.3% |
Table 3: Probability that a drafted player will swtich teams, given they have a career.
Fingers crossed our draft picks like the cold, because looks like a low chance of going anywhere!
CONCLUSION
My analysis here does not go beyond these probabilities. To truly understand the career potential of a given draft pick, we would need to gather all data on players from their Junior Hockey days, connect it to their NHL-level data, cluster these players into groups, and then compare the new crop of draft-picks to those clusters. However, this would involve putting much more effort into data collection, which I don’t have the time to do right now. If that ever changes, I’ll keep it in mind as a future analysis.
To wrap up, the draft is a gamble, but one every GM has to take. There are no guarantees your picks will work out, and the cost of scouting all the junior leagues across the world can be high. In the end, most of the players selected will not make a career in the NHL. I am keeping this in mind as I wait with bated breath for the upcoming season.
A big thank you to https://www.hockey-reference.com and http://www.hockeyabstract.com where this data was gathered.
BONUS NOTES
Originally, I thought I would load all of the data into a MySQL database to make it easier to join together, especially when you consider the way franchises changed over time. However, you'll notice I eventually switched over to loading the data directly from its original files for parts of the analysis. This was just quicker, as I did not initially build the database to contain all of the data, but soon realized I would need more than I had loaded.
Most of the analysis was done with Python on Jupyter Notebook, but some of the visualization was done using Tableau.
See the Github Repo for more info.