Since 2001, Ottawa's red light camera's have provided automated enforcement of red light running at intersections through fines. Between 2015 and 2019, there was a 137% increase in tickets issued, which begs the question: are the cameras working?
One would expect that a successful red light camera enforcement system would improve the safety of all users of an intersection, including pedestrians, cyclists, and other motorists.
Running a red light is dangerous, as other users, especially the most vulnerable, may already be moving into the intersection when a vehicle speeds through. Reducing this type of behaviour would be positive for the city as a whole to protect people from injury and death.
A study carried out in Houston found that on the whole, red light cameras did not have a significant impact on the number of collisions at an intersection, but they did change the nature of those collisions - more angle collisions without the camera, more rear-end collisions with.
On the City of Ottawa's site, the following is mentioned with regards to red-light cameras:
How do red-light cameras increase safety?
Public awareness of red-light cameras improves aggressive driving behaviour. Studies have shown that red-light violation rates can decrease as much as 42 percent within a few months of camera installation. The benefits of improved driving habits even spread into intersections without cameras.
Let's put that statement to the test.
Analysis
For this analysis, I will use 3 datasets provided by the City of Ottawa's Open Data Portal - red light violations, intersection volumes, and traffic collisions. Each dataset contains data over five years, 2015 to 2019.
Limitations
Admittedly, the data available for this analysis leaves quit a bit to be desired, something I plan to discuss in a future post. Note especially that the data available is not granular. The reason or timing of a collisions is not available, meaning if it occured due to running a red light cannot be determined. Further, the City does not provide speed limits at the intersection, nor does it provide the length of time of a light cycle, both of which could help explain red light running.
Further, there is no way to check if there are repeat offenders amongst the red light camera violations, meaning it is difficult to tell if this is a city-wide problem or mainly caused by a smaller core of reckless drivers.
Violations
First, there was a significant increase in red light violations over this span.
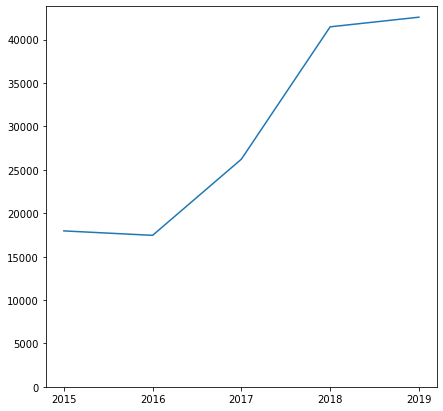
However, this graph does not tell us the full story. In fact, between 2015 and 2019, the total count of red light cameras in the city grew from 34 to 55.
Normalizing the annual numbers by averaging the count of violations over the total number of cameras per year, the increase from 2015 to 2019 drops to a seemingly more reasonable number of 46.5%.
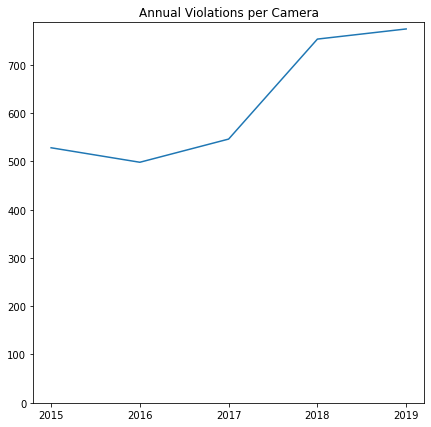
That said, the increasing count is still a worrying sign that automated enforcement at red lights may not be working as intended.
Collisions
Over the timespan, collisions reached a 5-year high in 2019 with 16,399, including 304 involving pedestrians and 296 involving cyclists.

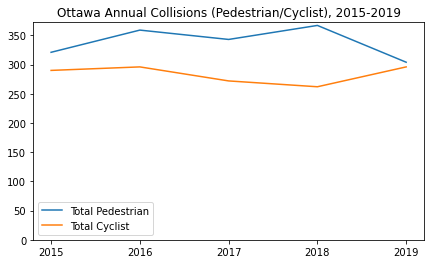
The charts above paint a picture of a relative flat amount of collisions, with limited increases or decreases between 2015 and 2019. While the red light cameras have no obvious impact overall, have they had any impact at their intersections?
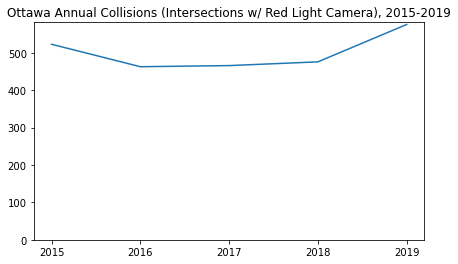
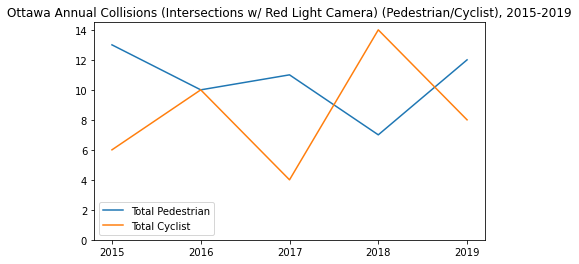
The count of pedestrian and cycling collisions is too low to draw much of a conclusion, however, seeing that the collision counts at intersections with red light cameras follows a similar distribution to the overall counts, it's difficult to say they are fully effective in this regard. Note that the data is not granular enough to indicate whether or not the crash was due to running a red light.
Intersection Volume
Over this same timespan, the 24-hour AADT (annual average daily traffic, or the total volume of vehicle traffic of a highway or road for a year divided by 365 days) at intersections actually decreased. Unfortuantely, there were not enough data points here to identify how the camera-equipped intersections performed relative to this city-wide average.

All of this points to a problem in the city - even as the volume of cars at intersections shifts downwards, the amount of red-light running increased year-over-year.
To get a better picture of red-light running overall, look at the cameras with the most (red), and least (green), counts of red light running.
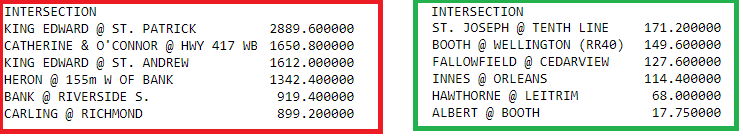
The numbers above are the annual average for that camera over the timespan. Interestingly, there is quite a mix of urban and subsurban between the red light cameras with the most and least violations.
As I mentioned in the limitations section, it's hard to identify an explanation for why certain intersections see more violations than others. It could be anything from the speed of the light changing from amber to red, to the length of time of the light cycle (I would hazard a guess that impatient drivers knowing they will be waiting for a while might risk running the red rather than be stuck through the cycle).
The Upside
Although it's difficult to tell if red light cameras are increasing safety, or even working at reducing red light running at all, there is a single, positive upside to all this.
As running a red light is an illegal maneuver, and all illegal vehicular maneuvers come with fines, the upside of all this is that the city has built a nice little source of revenue.
The fine for being caught by one of these cameras is $260 plus a $5 service fee and $60 victim surcharge. Working with just the $260 fine, the 42,578 violations in 2019 brought in over $11 million dollars in revenue.
While small change compared to the overall city budget ($3 billion in 2021), the revenue generated still helps pay for things like road resurfacing, and hopefully improving road designs to limit red light running in the future.
It also brings up an interesting point related to policing. It is almost a guarantee that these cameras bring in more revenue than the police ever could enforcing the same thing. Cameras are tireless, unthinking machines, whereas the police can only commit so many people to this type of role. Automated enforcement could reduce the amount of money that needs to be spent on policing and road enforcement, not to mention reduce incidents of racial profiling and abuse in traffic stops.
Conclusion
Overall, Ottawa saw an uptick in red light running between 2015 and 2019 even as intersection volumes decreased, a worrying trend. Further, the number of collisions during that span remained relatively stable.
Although the data does not allow us to say with absolute certainty that red light cameras are making intersection safer in Ottawa, we can conclude that they are having limited impact in actually stopping the behaviour they are designed to enforce.
So no, these cameras have not had the intended effect.
While they seem to have limited impact on driver behaviour, these cameras do provide an unorthodox source of revenue to the city, solely penalizing those breaking the law. At the same time, they provide secondary benefits by reducing interactions between police and motorists that have the potential to turn ugly or abusive.
Two conculsions can be drawn: 1, the penalty for the action is probably not significant enough; and 2, Ottawa, like Canada as a whole, could probably stand to invest a lot more effort into training its drivers.
Given this data is now a few years old, we will wait to see the numbers in the future. However, judging by the increase in red light running over the timespan, it seems like the city should consider how it can improve the impact of the cameras to prevent this behaviour moving forward.